
Welcome to iScience Maps
iScience Maps is a free Web service for scientists interested in using Twitter content in their research. This service allows one to assess the effects of specific events (e.g. a natural catastrophe or a political election) as they are voiced on Twitter. For example, make comparisons between cities, regions or countries for terms or combinations of terms and monitor their evolution in the course of an event.
The journal Behavior Research Methods published our article about iScience Maps. Download the article from here: (PDF). The reference is
Reips, U.-D., & Garaizar, P. (2011). Mining Twitter: Microblogging as a source for psychological wisdom of the crowds.Behavior Research Methods, 43, 635-642. doi http://dx.doi.org/10.3758/s13428-011-0116-6
Tim Skellett blogged about iScience Maps.
iScience Maps works at two different levels of detail: on a course-grained worldwide global search and a fine-grained local search.
Global Search
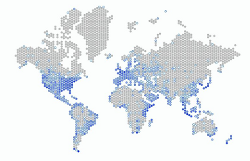
Global Search is for analyzing worldwide trends during a large period of time.
Global Search results are gathered from a random sample of worldwide geolocated tweets. The process of obtaining the Twitter content sample offered by iScience Maps is as follows:
- Twitter.com provides a Streaming API (Application Programming Interface) to third-party developers -like iScience Maps- to collect a random sample of all its content (1-10 % of total content).
- iScience Maps uses Twitter Streaming API to gather the content provided by Twitter.com and filters it, discarding all non-geolocated content.
- Each geolocated "tweet" (i.e., message sent via Twitter) is assigned to the nearest global region of iScience Maps' global map.
Below is a list of the features Global Search has to offer:
- Large date ranges (from 15th of September 2010 to the present day) in global queries.
- Detailed information on each region in pop-up dialogue windows.
- Boolean term searches with dynamic Web forms.
- Create animations showing temporal changes.
- Control the animation and analyze differences step by step.
- Links in Global Search's results allow users to reload previous results in the map viewer.
Local Search
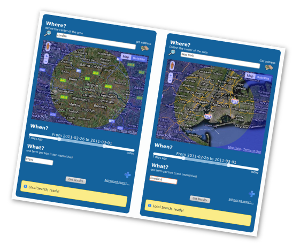
The iScience Maps Local Search application is intended for localized searches, in particular comparative studies of terms, regions and time periods.
Here is a list of the features provided in iScience Maps Local Search:
- Advanced location definition using Google Maps API v3 services:
- Zooming: To define areas each search panel has its own map widget to zoom in and zoom out.
- Geocoding: Initial location of the map can be defined via text-based search.
- Reverse geocoding: Once a specific location was defined using the map, the address of the center can be retrieved using Google Maps services.
- Easy date range definition using sliders.
- Boolean term searches with dynamic Web forms.
- Links in Local Searchs's results allow users to read actual content directly from Twitter.
- Automatic copy of search terms between panels to enhance comparative searches.
- Simultaneous searches using both search panels at the same time (via AJAX).
Export your results
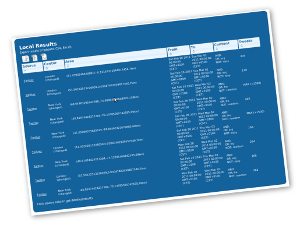
Both Global and Local Search applications provide a bottom panel with a dynamic results table. iScience Maps users can perform as many queries as they need and their results will be automatically stored in this table. The table can be downloaded in Excel or CSV format or copied to the clipboard.
iScience Maps results tables feature:
- Dynamic sorting: Results can be sorted by clicking a table's header cells.
- Intelligent links in source columns to reload previous results and read actual content directly from Twitter.
- Meaningful area range columns in Local Search results table, using the central point address in addition to latitude and longitude coordinates.
iScience Maps
Designed by: Ulf-Dietrich Reips & Pablo Garaizar.
Programmed by: Pablo Garaizar.
iScience: Experimental Psychology & Internet Science
Universidad de Deusto
Bilbao, Spain.
Acknowledgements
iScience Maps stands on the shoulders of giants. Here is a list of some of them:
- Twitter Search API & Twitter Streaming API.
- Google Maps API v3.
- Phirehose PHP library.
- jQuery Javascript Framework.
- jQuery UI.
- jQuery SVG.
- jQuery Tabletools.
- goMap.
- OpenJS.
- Linux, Apache, PHP, MySQL (LAMP).
Need help? Click here!
What?
one term per box (case insensitive)
Intervals
number of steps in animation
1 interval
Click region to see details


Export results (clipboard, CSV, Excel)
| Source | From | To | Content | Intervals | Tweets |
|---|
Need help? Click here!
define the center of the areaget address


Text-based area definition...
When?
one term per box (case insensitive)copy search terms »
Define the center of the areaGet address
Text-based area definition...
When?
« copy search termsone term per box (case insensitive)
Export results (clipboard, CSV, Excel)
| Source | Center | Radius | When | Content | Tweets |
|---|